COVID-19 Vaccination Trends
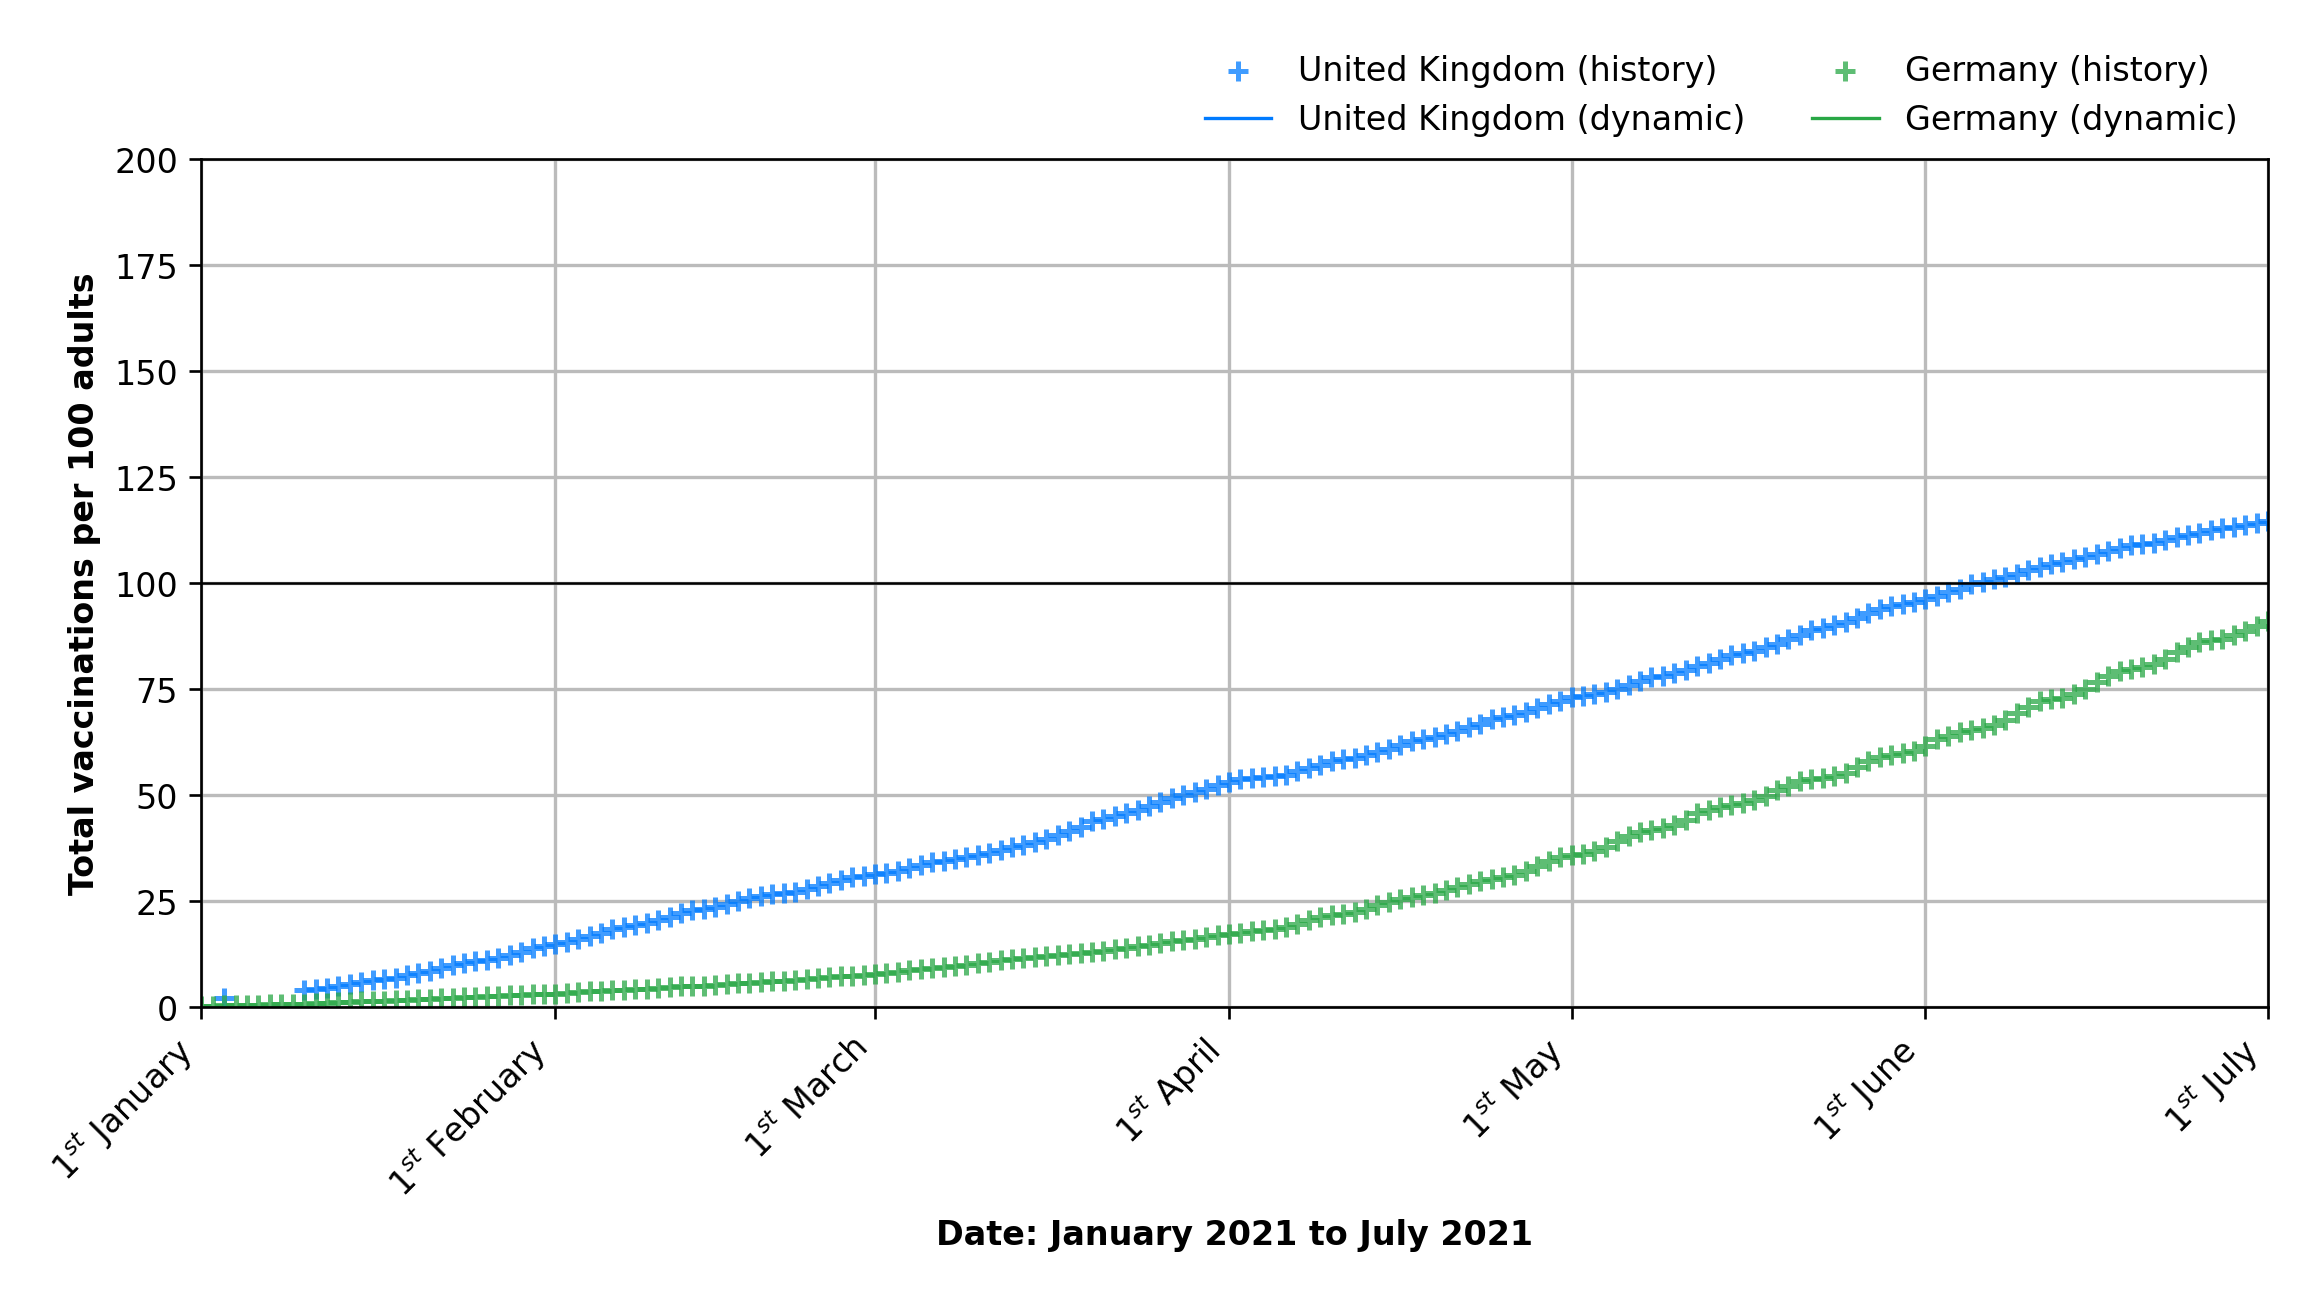
This chart shows historical data from the United Kingdom and Germany. Additionally, it displays extrapolations based on the last 31 days for a dynamic model and a linear model. The dynamic model assumes that the vaccination rate continues to change — i.e., we fitted a polynomial of degree two. The linear case assumes that the rate of vaccination remains the same.
The data is sourced from the Our World in Data project. Last update: 04 September 2021.
133.88 (+0.24/d)
Vaccinations per 100 adults
03 August 2021
Earliest day: 100 vacc. per 100 adults
19 April 2022
Earliest day: 200 vacc. per 100 adults
Last data from 02 September 2021.
122.09 (+0.28/d)
Vaccinations per 100 adults
03 August 2021
Earliest day: 100 vacc. per 100 adults
16 April 2022
Earliest day: 200 vacc. per 100 adults
Last data from 02 September 2021.
Project source code on GitHub: https://github.com/lambdapioneer/vactrend